PDF Publication Title:
Text from PDF Page: 005
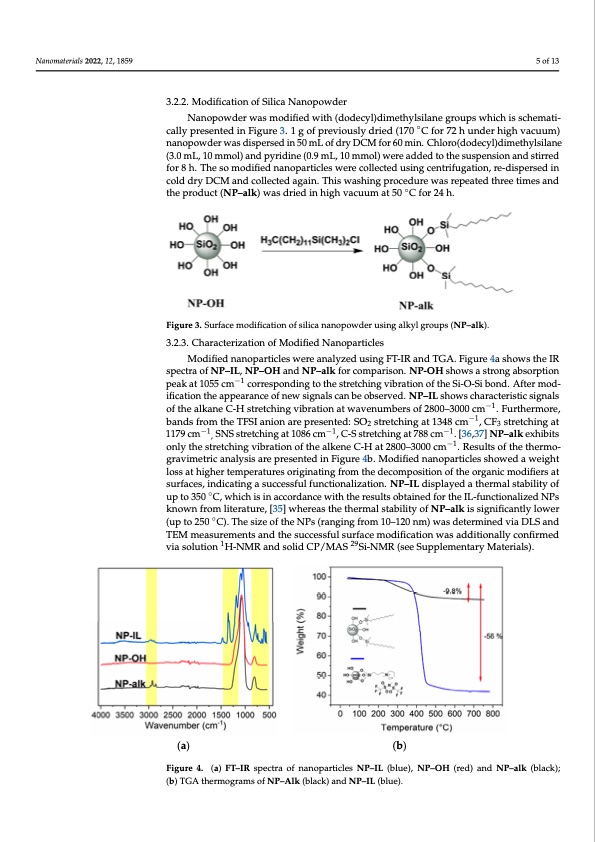
Nanomaterials 2022, 12, 1859 Figure 2. Surface modification of Ludox-sm® 30 with ionic liquid groups (NP-IL). 3.2.2. Modification of Silica Nanopowder 5 of 13 Nanopowder was modified with (dodecyl)dimethylsilane groups wh 22, 12, x FOR PEER REVIEW (up to 250 ◦C). The size of the NPs (ranging from 10–120 nm) was determ6inoefd1v4ia DLS and showed a weight loss at higher temperatures originating from the decom 3.2.2. Modification of Silica Nanopowder ically presented in Figure 3. 1 g of previously dried (170 °C for 72 h under Nanopowder was modified with (dodecyl)dimethylsilane groups which is schemati- nanopowder was dispersed in 50 mL of dry DCM for 60 min. Chloro( cally presented in Figure 3. 1 g of previously dried (170 ◦C for 72 h under high vacuum) thylsilane (3.0 mL, 10 mmol) and pyridine (0.9 mL, 10 mmol) were added nanopowder was dispersed in 50 mL of dry DCM for 60 min. Chloro(dodecyl)dimethylsilane (s3i.0omnLa,n10dmsmtiorlr)eadndfpoyrr8idhin.eT(0h.9emsLo, 1m0 modmiofli)ewderneanddoepdatortihcelesusswpenesrieoncaonldlesctitreredusing for 8 h. The so modified nanoparticles were collected using centrifugation, re-dispersed in re-dispersed in cold dry DCM and collected again. This washing procedur cold dry DCM and collected again. This washing procedure was repeated three times and three times and the product (NP-alk) was◦ dried in high vacuum at 50 °C f the product (NP–alk) was dried in high vacuum at 50 C for 24 h. Figure 3. Surface modification of silica nanopowder using alkyl groups (NP–alk). Figure 3. Surface modification of silica nanopowder using alkyl groups (NP-alk). 3.2.3. Characterization of Modified Nanoparticles Modified nanoparticles were analyzed using FT-IR and TGA. Figure 4a shows the IR 3.2.3. Characterization of Modified Nanoparticles spectra of NP–IL, NP–OH and NP–alk for comparison. NP-OH shows a strong absorption −1 peak atM10o55dcimfiedconrarenspoopnadrintgictloetshewsterretechaingavlyibzraetdionuosfinthge SFi-TO-ISRi baond. ATfGterAm.oFdi-gure 4 ification the appearance of new signals can be observed. NP–IL shows characteristic signals spectra of NP-IL, NP-OH and NP-alk for comparison. NP-OH shows a str of the alkane C-H stretching vibration at wavenumbers of 2800–3000 cm−1. Furthermore, peak at 1055 cm−1 corresponding to the stretching vibration of the Si-O- bands from the TFSI anion are presented: SO2 stretching at 1348 cm−1, CF3 stretching at −1, −1 −1 1m17o9 dcmificaStNioSnstrtehtcehiangpapte1a08r6acnmce ,oCf-Snsetwretcshiigngnatl7s88cacmn b.e[3o6b,3s7e] NrvPe–dal.kNexPhi-bIiLts show only the stretching vibration of the alkene C-H at 2800–3000 cm−1. Results of the thermo- signals of the alkane C-H stretching vibration at wavenumbers of 2800– gravimetric analysis are presented in Figure 4b. Modified nanoparticles showed a weight thermore, bands from the TFSI anion are presented: SO2 stretching at loss at higher temperatures originating from the decomposition of the organic modifiers at stretching at 1179 cm−1, SNS stretching at 1086 cm−1, C-S stretching at 788 c surfaces, indicating a successful functionalization. NP–IL displayed a thermal stability of up to 350 ◦C, which is in accordance with the results obtained for the IL-functionalized NPs alk exhibits only the stretching vibration of the alkene C-H at 2800–3000 c known from literature, [35] whereas the thermal stability of NP–alk is significantly lower the thermogravimetric analysis are presented in Figure 4b. Modified TEM measurements and the successful surface modification was additionally confirmed via solution 1H-NMR and solid CP/MAS 29Si-NMR (see Supplementary Materials). organic modifiers at surfaces, indicating a successful functionalization. N a thermal stability of up to 350 °C, which is in accordance with the results o IL-functionalized NPs known from literature, [35] whereas the thermal sta is significantly lower (up to 250 °C). The size of the NPs (ranging from 1 determined via DLS and TEM measurements and the successful surface m additionally confirmed via solution 1H-NMR and solid CP/MAS 29Si-NM mentary Materials). (a) (b) Figure 4. (a) FT−IR spectra of nanoparticles NP−IL(blue), NP−OH (red) and NP−alk(black); (b) TGA Figure 4. (a) FT–IR spectra of nanoparticles NP–IL (blue), NP–OH (red) and NP–alk (black); thermograms of NP−Alk (black) and NP−IL(blue). (b) TGA thermograms of NP–Alk (black) and NP–IL (blue). 3.3. 3D Printability of Composite Electrolytes via Rheology The desired composite electrolytes were prepared by mixing of the modified telechelic polymers with lithium salt and nanoparticles and subsequently analyzed via i d c e o o s 3 1 m p P b 0 o RPDF Image | 3D Printable Composite Polymer Electrolytes
PDF Search Title:
3D Printable Composite Polymer ElectrolytesOriginal File Name Searched:
nanomaterials-12-01859-v2.pdfDIY PDF Search: Google It | Yahoo | Bing
Product and Development Focus for Salgenx
Redox Flow Battery Technology: With the advent of the new USA tax credits for producing and selling batteries ($35/kW) we are focussing on a simple flow battery using shipping containers as the modular electrolyte storage units with tax credits up to $140,000 per system. Our main focus is on the salt battery. This battery can be used for both thermal and electrical storage applications. We call it the Cogeneration Battery or Cogen Battery. One project is converting salt (brine) based water conditioners to simultaneously produce power. In addition, there are many opportunities to extract Lithium from brine (salt lakes, groundwater, and producer water).Salt water or brine are huge sources for lithium. Most of the worlds lithium is acquired from a brine source. It's even in seawater in a low concentration. Brine is also a byproduct of huge powerplants, which can now use that as an electrolyte and a huge flow battery (which allows storage at the source).We welcome any business and equipment inquiries, as well as licensing our flow battery manufacturing.| CONTACT TEL: 608-238-6001 Email: greg@salgenx.com | RSS | AMP |