PDF Publication Title:
Text from PDF Page: 004
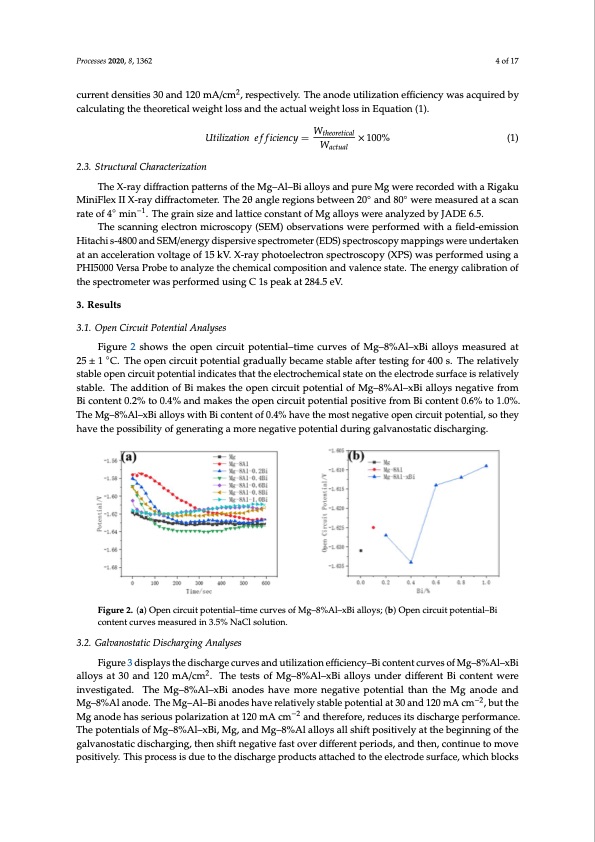
Processes 2020, 8, 1362 4 of 17 current densities 30 and 120 mA/cm2, respectively. The anode utilization efficiency was acquired by Processes 2020, 8, x FOR PEER REVIEW calculating the theoretical weight loss and the actual weight loss in Equation (1). Utilization efficiency WtheorWetical 100% Utilization efficiency= theoretical ×100% 4 of 17 2.3. Structural Characterization WW actual actual (1) (1) 2.3. Structural Characterization The X-ray diffraction patterns of the Mg–Al–Bi alloys and pure Mg were recorded with a Rigaku The X-ray diffraction patterns of the Mg–Al–Bi alloys and pure Mg were recorded with a Rigaku MiniFlex II X-ray diffractometer. The 2θ angle regions between 20◦ and 80◦ were measured at a scan MiniFlex II X-ray diffractometer. The 2θ angle regions between 20° and 80° were measured at a scan rate of 4◦ min−1. The grain size and lattice constant of Mg alloys were analyzed by JADE 6.5. rate of 4° min−1. The grain size and lattice constant of Mg alloys were analyzed by JADE 6.5. The scanning electron microscopy (SEM) observations were performed with a field-emission The scanning electron microscopy (SEM) observations were performed with a field-emission Hitachi s-4800 and SEM/energy dispersive spectrometer (EDS) spectroscopy mappings were undertaken Hitachi s-4800 and SEM/energy dispersive spectrometer (EDS) spectroscopy mappings were at an acceleration voltage of 15 kV. X-ray photoelectron spectroscopy (XPS) was performed using a undertaken at an acceleration voltage of 15 kV. X-ray photoelectron spectroscopy (XPS) was performed using a PHI5000 Versa Probe to analyze the chemical composition and valence state. The PHI5000 Versa Probe to analyze the chemical composition and valence state. The energy calibration of energy calibration of the spectrometer was performed using C 1s peak at 284.5 eV. the spectrometer was performed using C 1s peak at 284.5 eV. 3. Results 3. Results 3.1. Open Circuit Potential Analyses 3.1. Open Circuit Potential Analyses Figure 2 shows the open circuit potential–time curves of Mg–8%Al–xBi alloys measured at 25 ± 25 ±1 1°C.CT.hTehoepeonpecnirccuiritcupoittepnottiaelngtiraldguraalldyubaelclyambecsatambelesataftbelreteasftienrgtfeosrti4n0g0fso.rT4h0e0resl.atTivhelyresltatbivleely stabolpeeonpecnircuirictupiottpeonteianltianldiincdatiecsattehsathtahtetheleeectlreocctrhoecmheicmalicsataltsetaotne othnetheeleeclteroctdreodsuersfuacrfeaciserieslraetilvateilvyely stabsltea.blTe.hTehaedadidtiotinonooffBBiimakestheopencciricrcuuititpoptoetnetniatliaolfoMfgM–8g%–8A%l–AxBl–ixaBllioyasllonyegsantievgeaftriovmefBroim Figure 2 shows the open circuit potential–time curves of Mg–8%Al–xBi alloys measured at ◦ content 0.2% to 0.4% and makes the open circuit potential positive from Bi content 0.6% to 1.0%. The Bi content 0.2% to 0.4% and makes the open circuit potential positive from Bi content 0.6% to 1.0%. Mg–8%Al–xBi alloys with Bi content of 0.4% have the most negative open circuit potential, so they The Mg–8%Al–xBi alloys with Bi content of 0.4% have the most negative open circuit potential, so they have the possibility of generating a more negative potential during galvanostatic discharging. have the possibility of generating a more negative potential during galvanostatic discharging. Figure 2. (a) Open circuit potential–time curves of Mg–8%Al–xBi alloys; (b) Open circuit potential–Bi Figure 2. (a) Open circuit potential–time curves of Mg–8%Al–xBi alloys; (b) Open circuit potential–Bi content curves measured in 3.5% NaCl solution. content curves measured in 3.5% NaCl solution. 3.2. Galvanostatic Discharging Analyses 3.2. Galvanostatic Discharging Analyses Figure 3 displays the discharge curves and utilization efficiency–Bi content curves of Mg–8%Al–xBi Figure 3 displays the discharge curves and utilization efficiency–Bi content curves of Mg–8%Al– 2 alloysat30and120mA/cm.Th2etestsofMg–8%Al–xBialloysunderdifferentBicontentwere xBi alloys at 30 and 120 mA/cm . The tests of Mg–8%Al–xBi alloys under different Bi content were inveinsvtiegsatitgeadt.edT. ThheeMg–8%Al–xBiiaannooddeseshahvaevme omreornegnaetigvaetipvoetepnotitaelntthianl theanMtghaenModge andodMega–nd −2 −2 Mg–88%%AAllaannoodde.eT.hTeheMMg–gA–Al–lB–iBainaondoedsehsahvaevreerlaetlaivtievlyelsytasbtaleblpeopteontetinatlialta3t03a0nadnd12102m0mAAcmcm,bu,tbuthtethe −−2 MgMangoadneodheashsaesrsieoruiosupsoplaorlaizraiztaiotinonata1t21020mmAAccm andttheerreefoforere,,reredduucecsesitsitdsidscishcahrgaregpeeprfeorfmoramncaen.ce. The potentials of Mg–8%Al–xBi, Mg, and Mg–8%Al alloys all shift positively at the beginning of the The potentials of Mg–8%Al–xBi, Mg, and Mg–8%Al alloys all shift positively at the beginning of the galvanostatic discharging, then shift negative fast over different periods, and then, continue to move galvanostatic discharging, then shift negative fast over different periods, and then, continue to move positively. This process is due to the discharge products attached to the electrode surface, which positively. This process is due to the discharge products attached to the electrode surface, which blocks blocks the discharge process. The consequent sudden change in potential indicates the cracking ofPDF Image | Alloy Anode for Seawater Batteries and Related Mechanisms
PDF Search Title:
Alloy Anode for Seawater Batteries and Related MechanismsOriginal File Name Searched:
processes-08-01362.pdfDIY PDF Search: Google It | Yahoo | Bing
Product and Development Focus for Salgenx
Redox Flow Battery Technology: With the advent of the new USA tax credits for producing and selling batteries ($35/kW) we are focussing on a simple flow battery using shipping containers as the modular electrolyte storage units with tax credits up to $140,000 per system. Our main focus is on the salt battery. This battery can be used for both thermal and electrical storage applications. We call it the Cogeneration Battery or Cogen Battery. One project is converting salt (brine) based water conditioners to simultaneously produce power. In addition, there are many opportunities to extract Lithium from brine (salt lakes, groundwater, and producer water).Salt water or brine are huge sources for lithium. Most of the worlds lithium is acquired from a brine source. It's even in seawater in a low concentration. Brine is also a byproduct of huge powerplants, which can now use that as an electrolyte and a huge flow battery (which allows storage at the source).We welcome any business and equipment inquiries, as well as licensing our flow battery manufacturing.| CONTACT TEL: 608-238-6001 Email: greg@salgenx.com | RSS | AMP |